
-
Earth Science Journal!
Journal Entry #10 Topographic maps!
Vocabulary:
Contour interval – the change in elevation between adjacent contour lines.
Contour line – a line connecting points of equal elevation on a map.
Depression contour – a contour line with hachure marks to indicate depression.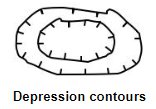
Elevation – the height of a location above a fixed reference point, usually sea level.
Gradient – the slope of a surface or line.
To calculate the gradient of a surface between two points, divide the change in elevation by the horizontal distance between the points.
Topographic map – a map that uses contour lines to depict variations in elevation across a landscape.- Contours that form closed curves usually indicate hills or mountains but can also indicate depressions.
- Contours that are close together indicate steep slopes, while contour lines that are far apart indicate flatter terrain.
- Contour lines in a river valley or stream are often V-shaped, with the point of the V pointing uphill.
Watch these videos and answer the questions that go along with the images.
Be sure to tape the images in your journal.How to find the steepest slope on a topographic map.

1. Label the steepest and flattest slopes and explain how you can tell which area is the steepest.
How to find which way a stream flows on a topographic map.

2. Label the direction in which this stream flows with an arrow.
Explain how you know the stream flows in that direction.
Be careful; the image in the video is different.
How to find the lowest point on a topographic map.

3. Label the lowest elevation on this map and explain how you know it is the lowest point.
How to find the highest point on a topographic map.

4. Explain how you can determine the highest possible elevation for Rock Mountain.
How to find the gradient between two points on a topographic map.

5. Explain how to find the gradient between points X and Y.
Show all your work and include proper units in your answer.
How to draw a profile between two points on a topographic map.

6. Draw a profile between points X and Y and explain your procedure.
Testing your knowledge
Answer the following in your journal.

7. What are the elevations of points A, B, and C?
8. Which direction is the river flowing? How can you tell?
Find the elevations for these contour lines.
9. What is the highest possible elevation for point A?
10. What is the lowest possible elevation for point D?
11. What is the gradient between positions E and F? Show all work.Watch the following videos and take notes in your journals.
Explain how to draw contour lines.
Explain how to create a profile.
Explain how to calculate the gradient.
ReflectionExplain what you learned about topographic maps.Bonus
Build an IslandINTRODUCTION
For this assignment, you will create a topographic map and a three-dimensional model of a fictional island you have designed. You will start by exploring basic information about topographic maps and their creation. See the Background Information section below for directions on how to do this. You may then begin by drawing a map of your island by following the Part 1 Instructions found below. After drawing your island, you must get it approved by your teacher. Once your map is approved, you may begin building your model by following the Part 2 Instructions found below.
BACKGROUND INFORMATION
A topographic map is a two-dimensional representation of part of the Earth’s three-dimensional surface, drawn to scale. Also called a “topo” map. The features shown on topographic maps may be divided into three groups:
1. relief, which includes hills, valleys, mountains, etc.
2. water features, including lakes, ponds, and streams
3. cultural features; man-made features like bridges, canals, buildings, and roadsRelief is the difference in elevation between any two points. Where the relief is low, the area appears to be relatively flat, as in river valleys or broad, flat uplands. When relief is high, the area is steep, as in rugged mountainous terrain. Relief is shown on a contour map by contour lines.
A contour line is an imaginary line on the Earth’s surface connecting points of the same elevation. A map’s contour interval is the difference in elevation between adjacent contour lines and must be consistent for a given map, though they may change from map to map. Usually, every fifth contour line is printed heavier than the others and bears the elevation above sea level (an “index contour line”).
The map scale expresses the relationship between the distance on the map and the true distance on the Earth's surface. This is generally expressed as a ratio or a fraction, such as 1:24,000 or 1/24,000. The numerator, usually 1, represents map distance, and the denominator, a large number, represents ground distance. Thus, 1:24,000 means that a distance of 1 unit on the map represents 24,000 such units on the ground. The unit here is unimportant — it could be meters, feet, or inches. What is important is the relationship between the map distance and the true ground distance.
Rules of Contour Lines
1. Every point on a given contour line is of the exact same elevation; contour lines connect points of equal elevation.
2. Contours do not cross or intersect each other (except in the rare case of an overhanging cliff, in such a case, the hidden contours are dashed).
3. All contours eventually close to form an irregular circle or run off the map.
4. Contours near the upper parts of hills form closures (circles). The top of a hill is higher than the highest closed contour.
5. Contours are widely spaced on gentle slopes.
6. Contours are closely spaced on steep slopes.
7. Each adjacent contour line must maintain the same increase or decrease in elevation.
8. Where a contour line crosses a stream or valley, the contour bends to form a "V" that points upstream or valley. In the upstream direction, the successive contours represent higher elevations.
9. Hachure contour lines show depressions. Hachure contours are contours with short lines on the inside pointing downslope. The bottom of the depression is lower than the lowest closed contour.PART 1 INSTRUCTIONS
1. On a piece of printer's paper (not looseleaf!), please neatly draw a topographic map of an island. You may need to try it a few times before getting it the way you want. Do it in pencil first; then, you should review it in marker to make the lines and other features stand out.
Your map MUST include the following features:
✓ A minimum of six contour lines
✓ A minimum of one high point (a mountain peak), marked with the maximum elevation (a “spot elevation”)
✓ A river
✓ A compass rose
✓ A statement of the contour interval
✓ A map scale
✓ A minimum of one depression
✓ Any landmarks or features that would be fun to show, such as roads, buildings, or a lake.Show your completed map to your teacher for approval before beginning part 2.
PART 2 INSTRUCTIONS
1. Make a photocopy of your map. This is very important as you will need to cut your map, and you don’t want to destroy your original. You must submit both a map and a model.
2. On your photocopied map, cut out the lowest elevation, which should be the outermost and biggest circle or contour line. There will be smaller circles in the middle. Ignore those for now. Trace your cut-out on the material you are making the model out of and cut it out (either foam board or thick cardboard).
This is the base of your 3-D model.3. Repeat this procedure for the rest of the lines on the topographic map. Cut out each contour line circle, trace it onto the material, and cut out the material. Your circles should get smaller and smaller. Go ahead and discard your cut-up map pieces once you have the cut-outs to keep. Number the cutouts. Be sure to keep the cutouts stacked up in order so the biggest piece is on the bottom.
4. Glue or attach each cut-out to the one below it. Let the glue dry.
5. Add color to show the features such as rivers, lakes, roads, etc., and label your model.
6. Create a Compass Rose on your map with four arrows that designate North, East, South, and West.
7. Add a scale that will represent the distance. For example, one inch represents one mile.
8. Add a legend or key to the elements on your map and a statement of the contour interval.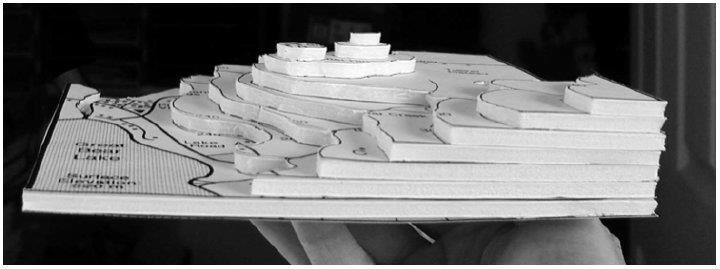 _______Answers!
 7. What are the elevations of points A, B, and C?A = 220 meters, B = 180 meters, C = 140 meters8. Which direction is the river flowing? How can you tell?East, because the V's point upstream.
Also, water flows from a higher elevation to a lower elevationFinding the highest and lowest possible elevation.
 9. What is the highest possible elevation for point A?Highest possible elevation for point A = 29 meters10. What is the lowest possible elevation for point D?Lowest possible elevation for D = 1 meter
11. What is the gradient between positions E and F?Gradient = (change in Field Value) ÷ distanceGradient = (50 meters - 10 meters) ÷ 2 km
Gradient = 40 meters ÷ 2 km
Gradient = 20 m/km