
-
Earth Science Journal!
#20 Title: My Weather Station
This journal entry will help you with your next laboratory.
There are thousands of weather stations throughout the United States.
Here are but a few. Yuck! Too much information at once.
Imagine if your TV Weather Person showed you today's forecast with this map!Please write this definition of a weather station model in your journal.
The station model is a symbolic illustration of the weather at a specific location.
We need weather stations to record the outside conditions so meteorologists can better predict the weather.
We have a weather station on the roof of our school!Let's pretend that you are Wilson's weather station!
If we bundle you up and put you on the roof, you will need instruments to record your data.
Please write down five things you think you will need to record the weather outside. Brainstorm with your partner.
Tools to record weather!
Define the following in your journal.
You all know this instrument.

Thermometer: measures the average kinetic energy of the air
(heat due to molecular collision friction)
What is this instrument?

Barometer: measures Air Pressure (weight of the air above you)
Low = Stormy (Sad) High = Sunny (Happy)
What is this instrument?

Sling Psychrometer: measures the amount of water vapor in the air
Use charts (ESRT) to find the Dew Point and Relative Humidity
What is this instrument?

Anemometer: measures the speed of the wind (speedometer for the wind)
What is this instrument called?

What direction is the wind blowing?
Weather (wind) Vane: shows the direction wind comes from
Rooster faces into the wind (does not want to ruffle his feathers)
This is an East wind that blows toward the West.
What is this instrument called?

Rain Gauge: Measures the amount of rain in inches. Note: snow depth is usually measured with a ruler.
I am sure that you thought of some other devices that would be helpful.
Let's put you on the roof!
This red dot is right above our classroom.Where is North?

What time do you think this photo was taken?

Scroll over the image above to find out.
Draw a circle (freehand) about the size of a dime.
Do NOT draw the square around your circle or write the compass directions.
Note: Maps are usually aligned, so North is toward the top of the page.

This shows you that the "corner" positions are crucial.There is so much information to place around your station model dot that it needs to be coded in a highly organized manner.
The placement of this information tells us what the information means.
Completely shade in your circle.
What do you think shading the circle represents?
Cloud cover

Draw the above circles and label their percent of cloud cover and shade in the circle appropriately.
Cloud cover: shading a pie chart for the percentage of the cloudy sky

The percentage of cloud cover is shown as a pie graph.
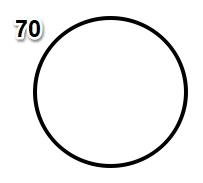
Temperature is always located in the dot's upper left "corner."

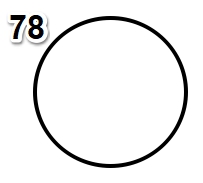
Don't label the units!
We know what the number means because of its location.
So, in the above station model, it is 78 degrees Fahrenheit.
The regents are very picky about placing information on your station model.
Place the following temperatures on the station models.
21°C -10°C 283 k
Answers Below
Did you convert to Fahrenheit?
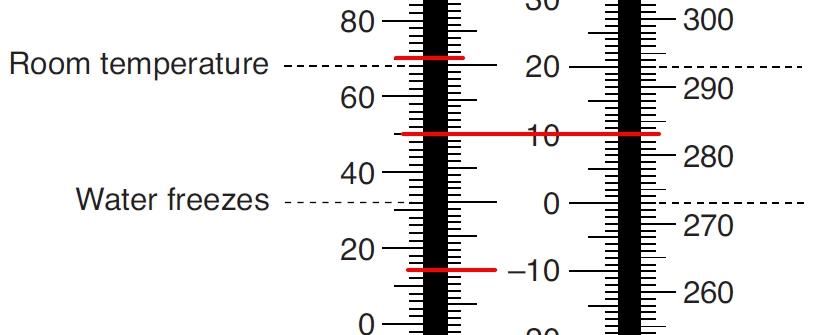
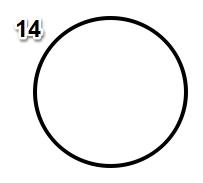
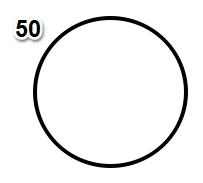
21°C -10°C 283 k
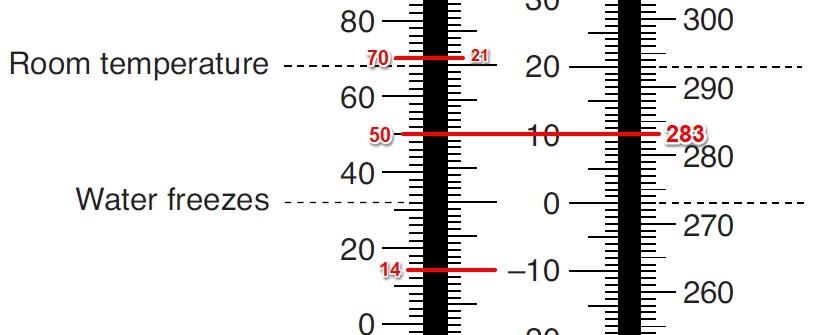
Remember that every 1 degree Celsius or Kelvin is 2 degrees Fahrenheit!
Air Pressure!
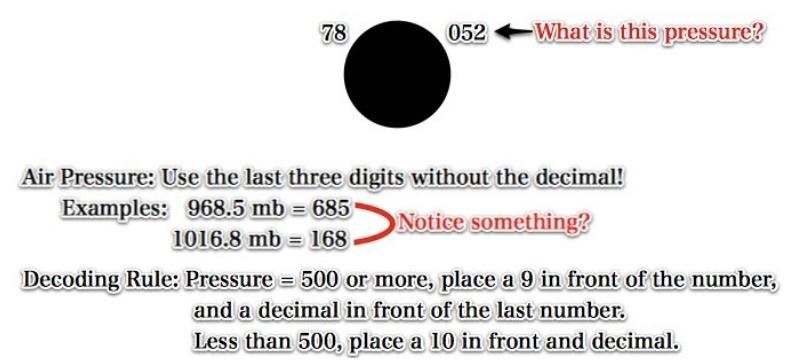
Write down the above Decoding Rule in your journals.
What do you notice about these numbers when converted?
The higher number (685) is a lower pressure when converted!
Using the decoding rule above
052 = 1005.2 mb
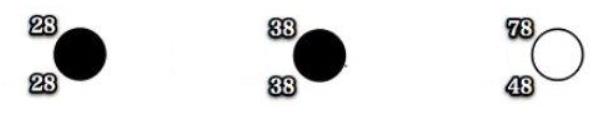
Which of these pressures below do you think is the highest and lowest?
Draw the station models below in your journal.
Place an H and L in the circles of your choice,
representing the highest and lowest pressures.
Answer below
_
_

Now, place these pressures on their weather stations.


1034.8 mb 968.5 mb 1000.2 mb
_
_
Answers Below


1034.8 mb 968.5 mb 1000.2 mb
Try these ten to ensure you can convert these millibar (mb) pressures.
1. 
= 1029.5 mb _______ 6. 
= 982.1 mb 2. 
= 990.5 mb 7. 
= 1022.0 mb 3. 
= 974.0 mb 8. 
= 1000.0 mb 4. 
= 1010.8 mb 9. 
= 999.9 mb 5. 
= 1005.0 mb 10. 
= 1038.3 mb Which of the above ten pressures is the highest and lowest?
You will need your reference tables on page 13.
Plot the highest and lowest pressures in your reference tables.
Answers below.

Write down and try this example.
29.50 inches =
You will need to convert it from inches of Mercury to millibars.
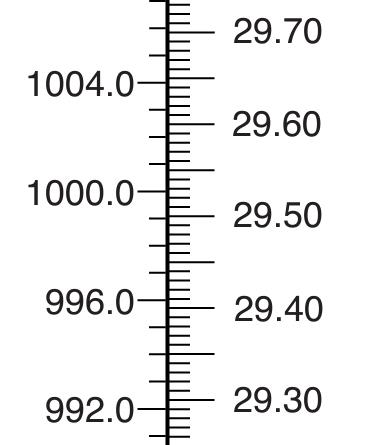
Convert it to the nearest whole number.
29.50 inches = 999.0 mb
On your station model.

Drop the 9 and decimal.
Dewpoint Temperature
Write the following in your journal.

Which station model would most likely have rain?Why?
_
_

Precipitation is more likely when the actual and dewpoint temperatures are close together.
Station models don't write rain or snow; they use symbols!
Place that appropriate symbol of the present weather in the proper location.
Answers


Let's add the wind direction to our station model.
Wind from the Southeast at 25 knots

What direction is the wind blowing?
It is a Southeast wind.
It was blowing from the southeast toward the northwest.How fast is the wind blowing?

Draw these three circles and show the wind speed and direction in each.
Be sure to write down each wind speed and direction in your journals.
Answers

You don't need to memorize this!
Turn to your Earth Science Reference Tables on page 13!
Now, you are ready to do your lab!
There are some essential details that you need to know.
Check out the video below to reinforce what you have learned and go a bit further.
Reflection: Write down the three most important things about weather stations.
You are now ready to do your next laboratory!
Additional information
The history behind the temperature scales: Fahrenheit, Celsius, and Kelvin.
https://www.livescience.com/39841-temperature.html
http://abyss.uoregon.edu/~js/glossary/temperature_scale.html
http://iopscience.iop.org/article/10.1088/0953-2048/4/11/040/pdf
Regents Earth Science Core Curriculum
PERFORMANCE INDICATOR 2.1
2.1c Weather patterns become evident when weather variables are observed, measured, and recorded. These variables include air temperature, air pressure, moisture (relative humidity and dewpoint), precipitation (rain, snow, hail, sleet, etc.), wind speed and direction, and cloud cover.
2.1d Weather variables are measured using instruments such as thermometers, barometers, psychrometers, precipitation gauges, anemometers, and wind vanes.
2.1g Weather variables can be represented in a variety of formats, including radar and satellite images, weather maps (including station models, isobars, and fronts), atmospheric cross-sections, and computer models.